Contact Center Experts
A compass for the manager: 30 call center metrics to monitor productivity and efficiency

Call center metrics are a vital tool that plays a key role in measuring and improving customer service. They are like a pulse that reflects the health of the company’s communication system, allowing you to dive into the depths of interaction with customers and extract valuable data from there for strategic analysis. Do operators answer calls quickly? How effective are they at solving problems the first time? What emotions do customers have after the conversation? The answers to these questions and many others lie in the metrics that are carefully studied and analyzed at Savilinx.
With the help of these indicators, you can not only monitor current performance, but also predict future trends, adapt to changes in consumer behavior, and make timely adjustments to the work of the call center. Thus, metrics become indispensable assistants in the pursuit of perfection.
We’re happy to share information about how this data helps us improve productivity and customer satisfaction, so we’ve prepared for you a selection of key metrics that will reveal the secrets of an effective call center.
- Customer Satisfaction (CSAT)
- Net Promoter Score (NPS)
- First Call Resolution (FCR)
- Customer Effort Score (CES)
- Service Level
- First Contact Resolution Rate
- Customer Churn Rate
- Contact Quality
2. Performance and efficiency metrics:
- Average Handle Time (AHT)
- Call Abandonment Rate
- Average Speed of Answer (ASA)
- Average After Call Work (ACW)
- Call Transfer Rate
- Occupancy Rate
- Time in Queue
- Longest Delay in Queue
3. Performance metrics and financial metrics:
- Conversion Rate
- Average Revenue Per Call (ARPC)
- Cost Per Contact
- Forecast Accuracy
- Budget Variance
- Strategic Goal Achievement
5. Metrics of technical efficiency:
Takeways:
- Metrics for Comprehensive Analysis: Call centers utilize customer service, performance, workforce, and technical efficiency metrics to evaluate and enhance operations.
- Key Indicators: Metrics like CSAT, NPS, and FCR focus on customer satisfaction and loyalty, while others like AHT and CPC improve operational efficiency.
- Cost and Efficiency: Monitoring financial metrics like ARPC and CPC enables call centers to optimize expenses while maintaining service quality.
- Workforce Productivity: Metrics like adherence to schedule and attrition rate help manage employee performance and engagement effectively.
- Strategic Focus: Selecting the right metrics tailored to business goals ensures actionable insights and long-term improvements.
1. Customer service metrics
Customer service metrics in call centers play a critical role in measuring and improving service quality. They make it possible to assess the speed and efficiency of response to customer requests, as well as user satisfaction with services. Through the analysis of this data, it is possible to identify weak points in the work and develop strategies to eliminate them, which contributes to increasing the efficiency and competitiveness of the call center. The use of metrics is the key to optimizing resources and increasing customer satisfaction, which is the basis for building long-term relationships with them.
Customer Satisfaction (CSAT)
The Customer Satisfaction metric (CSAT) reflects the level of customer satisfaction with call center services, which is an important indicator of the quality of service and interaction with consumers.
The calculation of CSAT is based on the collection of feedback from customers, who usually express their satisfaction through surveys, where they rate their experience on a scale (for example, from 1 to 5). The CSAT indicator is calculated as a percentage of positive feedback from the total number of responses. A score that is significantly lower than the industry average is considered poor, a score that is close to the average is considered neutral, and a score that is high indicates excellent call center performance.
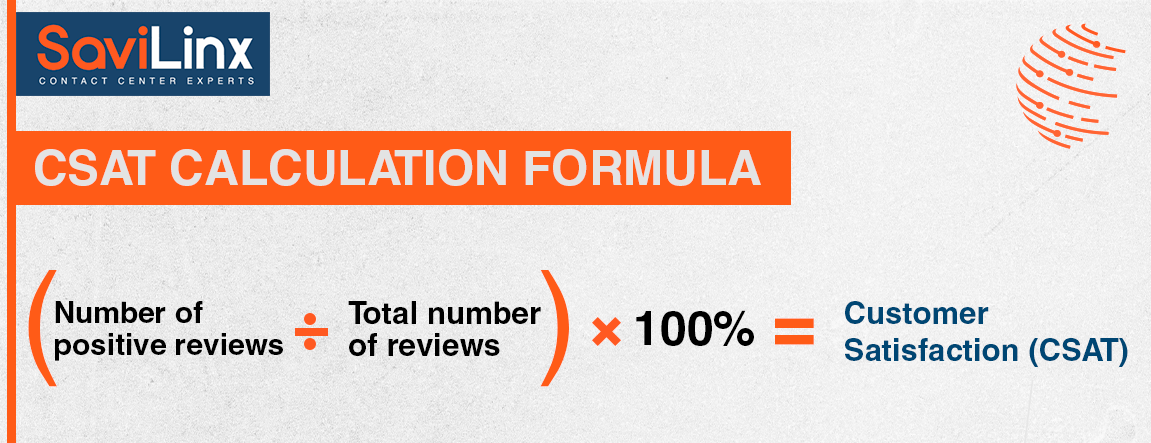
CSAT calculation formula: (Number of positive reviews / Total number of reviews) * 100% = Customer Satisfaction (CSAT)
To improve CSAT scores, call centers need to focus on training and developing the skills of employees so that they can effectively solve customer problems. It is also important to implement a feedback system that will allow you to promptly respond to negative feedback and improve the service. Investing in technology that improves customer interaction can also significantly increase CSAT, as can working to personalize service to create a positive customer experience.
Net Promoter Score (NPS)
Net Promoter Score (NPS) is a metric that measures the willingness of customers to recommend call center services to others, reflecting the level of customer loyalty and satisfaction.
NPS is calculated based on customers’ answers to one key question: “How likely are you to recommend our company to friends or colleagues?” Answers are classified on a 10-point scale, where 0 means “hardly recommend” and 10 means “definitely recommend”. Respondents are divided into critics (0-6 points), neutral (7-8 points) and supporters (9-10 points).
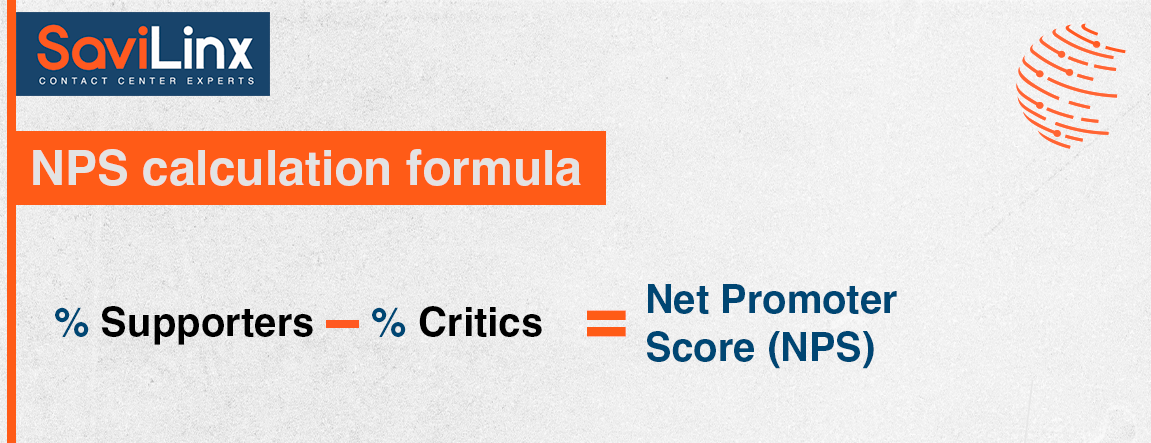
NPS calculation formula: % Supporters – % Critics = Net Promoter Score (NPS)
The indicator is considered bad if it is negative, neutral if it is close to zero, and good if it is positive and above 50.
To improve NPS, call centers should focus on improving service quality and providing a positive experience for each customer. This can include personalizing interactions, resolving issues quickly and efficiently, and creating added value through loyalty programs and tailored offers. It is also important to provide feedback from customers to understand and consider their expectations and preferences.
First Call Resolution (FCR)
The First Call Resolution (FCR) metric reflects the percentage of customer inquiries that were resolved immediately on the first call, a key indicator of call center service performance.
FCR is calculated by dividing the number of calls resolved from the first call by the total number of calls for a given period and multiplying the result by 100 to get the percentage. A high FCR indicates the efficiency and speed of the call center, while a low number may indicate problems in the service processes or insufficient competence of the staff. A neutral score is between high and low and requires attention for further improvement.
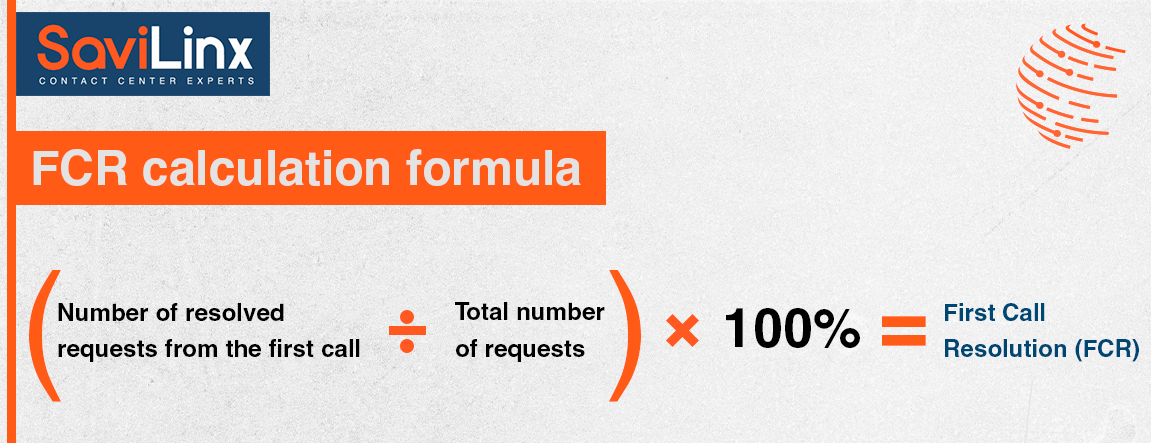
FCR calculation formula: (Number of resolved requests from the first call / Total number of requests) * 100% = First Call Resolution (FCR)
To improve FCR, call centers need to provide a high level of education and training to operators so that they have all the necessary knowledge and tools to solve customer problems. It is also important to implement effective internal support systems and knowledge bases that allow operators to quickly find
information and solutions. In addition, analyzing the reasons for repeat calls can help identify and eliminate systemic deficiencies in service processes.
Customer Effort Score (CES)
The Customer Effort Score (CES) metric tracks how easily customers can interact with a call center and achieve their goals, playing a critical role in shaping their overall satisfaction.
CES is usually calculated using a survey where customers are asked to rate how easy or difficult it was for them to solve their problem on a scale, for example, from 1 (very easy) to 7 (very difficult). The lower the number, the better, as it means that it was easier for the customer to solve their question. A high CES score may indicate that customers have to exert significant effort, which is negative for the user experience.
CES calculation formula: Sum of all ratings / Number of responses giving the average value of effort that customers consider necessary = Customer Effort Score (CES)
To improve CES, call centers can work to simplify service processes by providing more intuitive and convenient ways to interact with customers. This can include improving user interfaces, automating standard procedures and providing more detailed information that will help customers achieve the desired result faster. It is also important to ensure that call center personnel have the necessary knowledge and tools to effectively resolve customer inquiries with minimal effort on their part.
Service Level
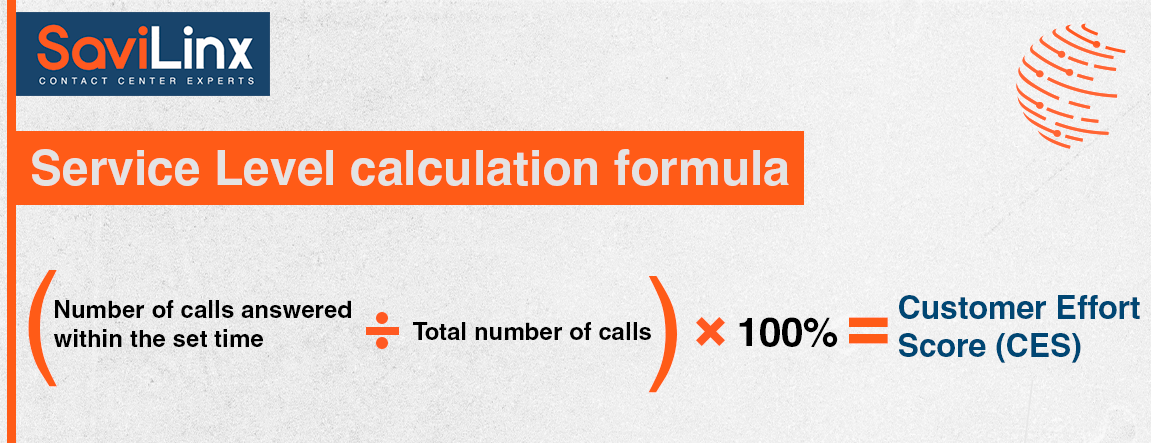
The Service Level metric in call centers reflects the percentage of calls that were answered within a specified time threshold.
Service Level is calculated as the percentage of incoming calls that were answered within a certain time (for example, 20 seconds) relative to the total number of calls. A high response rate in a short period of time is considered a good indicator, while a low response rate may indicate operational issues or peak periods to work with.
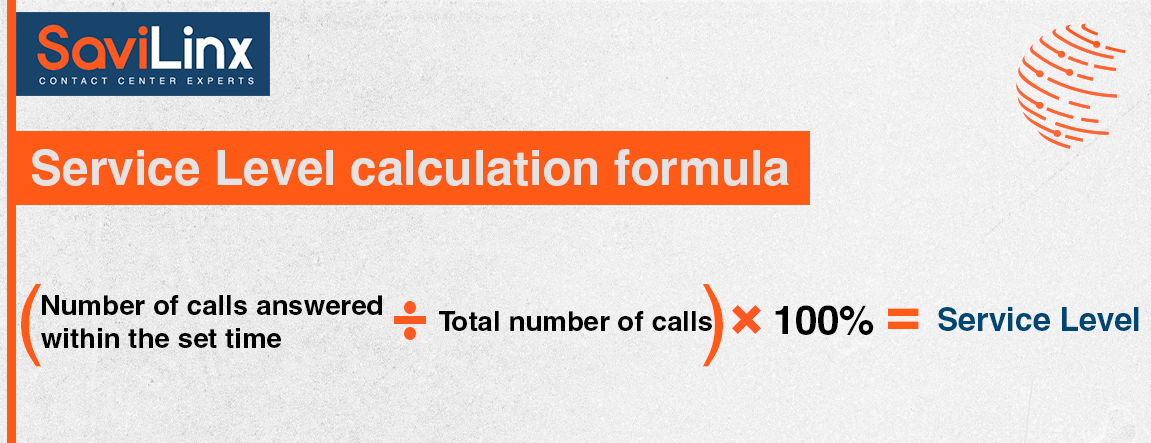
Service Level calculation formula: (Number of calls answered within the set time / Total number of calls) * 100% = Service Level
To improve the Service Level, call centers need to optimize the operator’s work schedule, ensuring a sufficient number of personnel during peak hours or days. It is also important to use advanced technologies to monitor call traffic and predict load so that you can react quickly to changes. Training and development of operators’ skills will also contribute to faster resolution of customer requests, which will have a positive effect on the Service Level.
First Contact Resolution Rate
First Contact Resolution Rate (FCRR) is a metric that measures the percentage of cases in which customer inquiries are resolved immediately during the first contact with a call center, regardless of the communication channel. While FCR tracks whether the customer’s problem was resolved during the first phone call to the call center.
FCRR is calculated by dividing the number of inquiries that were resolved from the first call by the total number of inquiries received by the call center during a given period. The result is expressed as a percentage. A high FCRR indicates that the call center is effective in solving customer problems the first time, leading to increased customer satisfaction and lower costs. A low score may indicate a need to improve service processes.
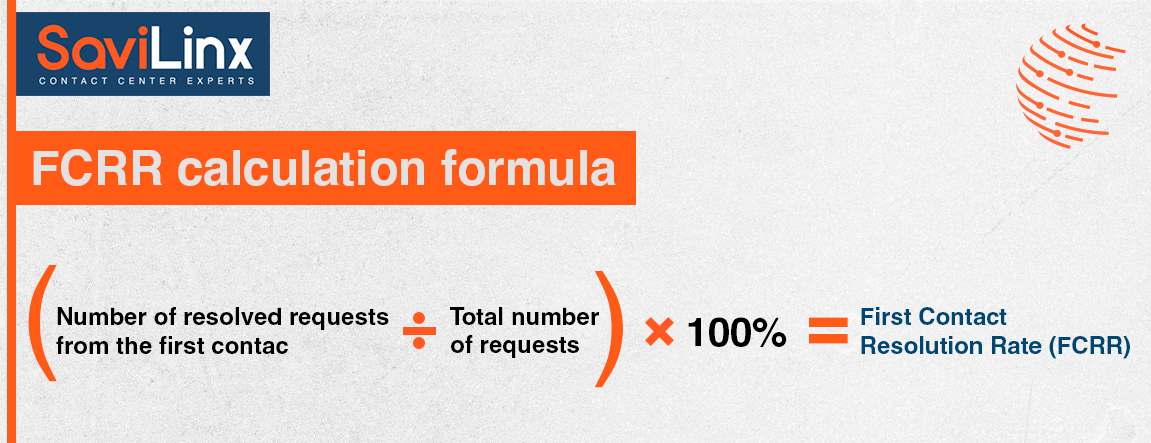
FCRR calculation formula: (Number of resolved requests from the first contact / Total number of requests) * 100% = First Contact Resolution Rate (FCRR)
To improve FCRR, call centers need to ensure that operators have access to comprehensive information and resources to help them resolve inquiries effectively. This may include developing detailed knowledge bases, training staff in problem-solving skills, and using CRM systems to collect customer information. It is also important to analyze the reasons why it is not possible to solve the request the first time and take measures to optimize processes and improve communication within the team.
Customer Churn Rate
Customer Churn Rate (CCR) is a metric that tracks the percentage of customers who stop using a company’s services over a period of time, a critical metric for measuring customer loyalty and satisfaction.
CCR is calculated by dividing the number of customers who left the company by the total number of customers at the beginning of the measurement period and multiplying the result by 100 to obtain a percentage. A high CCR is negative because it indicates high customer churn, while a low CCR indicates a stable customer base.
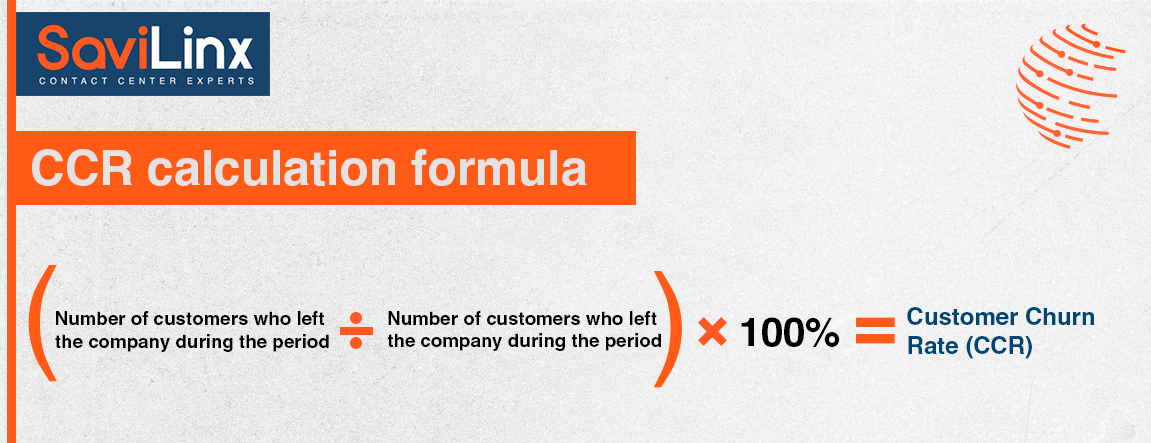
Formula for calculating CCR: (Number of customers who left the company during the period / Total number of customers at the beginning of the period) * 100% = Customer Churn Rate (CCR)
To reduce the Customer Churn Rate, call centers need to focus on improving service quality and providing a positive customer experience. This may include regular customer feedback, personalized offers, product and service improvements, and quick and efficient problem resolution. It is also important to use data to analyze the reasons for customer churn and develop strategies to retain them.
Contact Quality
The “Contact Quality” metric in call centers determines the quality of interaction between the operator and the client, assessing the level of client satisfaction and the effectiveness of communication.
Contact quality is typically assessed using a combination of quantitative and qualitative measures, including analysis of customer feedback, internal assessments of compliance with service standards, and conversation monitoring. There is no universal formula for calculating “Contact Quality”, as it can include various indicators, such as response time, completeness of problem solving, tone of conversation, use of scripts, and others. A good contact quality score indicates high customer satisfaction and service effectiveness, while a poor score may indicate communication problems or poor service levels.
To improve “Contact Quality”, call centers need to conduct regular training for operators, focusing on communication skills, problem solving and empathy. It is also important to establish clear service standards and regularly monitor adherence to these standards through internal audits and analysis of interactions. Collecting and analyzing customer feedback will help identify weaknesses and develop effective strategies
2. Performance and efficiency metrics
Productivity and efficiency metrics in call centers play a key role in determining operator efficiency and customer service speed. They allow you to assess how well the call center uses its resources, adapts to the flow of requests and performs the assigned tasks. Analyzing these metrics can reveal the potential to optimize workflows and improve overall productivity, which directly impacts customer satisfaction and business success.
Average Handle Time (AHT)
Average Handle Time (AHT) is a metric that measures the average time spent by a call center operator handling a single call, including talking to the customer, resolving inquiries, and post-call work.
AHT is calculated by adding the total talk time, hold time, and time spent on call handling and dividing that amount by the total number of calls handled. The ideal AHT depends on the specifics of the business and the type of requests, but generally a lower AHT is considered better because it indicates a more efficient service. However, an AHT that is too low may indicate haste and insufficient attention to customer needs, while a high AHT may be a sign of inefficiency.
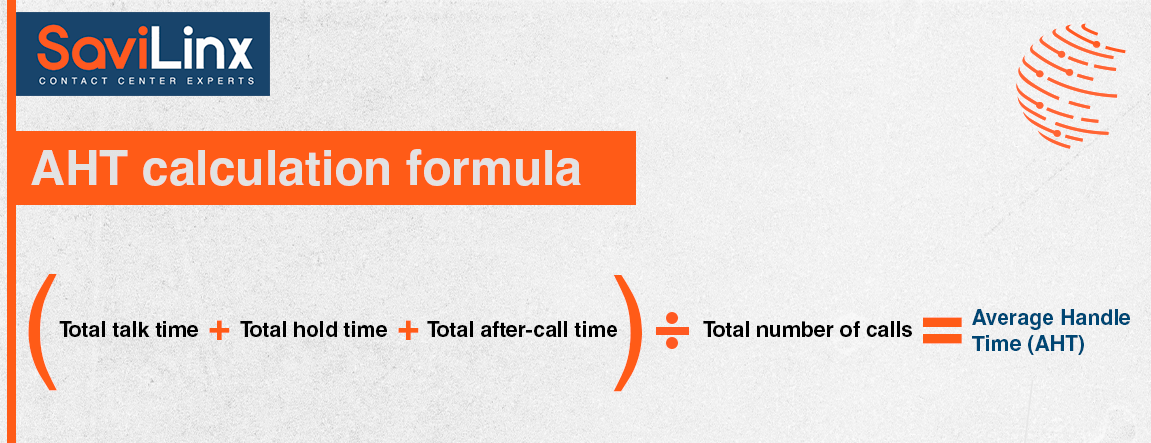
The formula for calculating AHT looks like this: AHT = (Total talk time + Total hold time + Total after-call time) / Total number of calls = Average Handle Time (AHT)
To improve AHT, call centers need to ensure that operators are properly trained so that they can quickly identify customer problems and provide effective solutions. Using scripts for standard queries and automating frequent processes can also help reduce processing time. In addition, data analysis allows you to identify common causes of delays and develop strategies to optimize work processes, which will ultimately lead to a reduction in the average call processing time.
Call Abandonment Rate
Call Abandonment Rate (CAR) is the percentage of calls that customers abandon before a call center operator answers, reflecting the level of service availability and responsiveness.
CAR is calculated by dividing the number of calls that were terminated by customers before connecting to an operator by the total number of incoming calls and multiplying the result by 100 to obtain a percentage. A high CAR is an indicator of poor service because it indicates that customers are made to wait too long or experience other inconveniences. A low CAR indicates that most calls are handled efficiently.
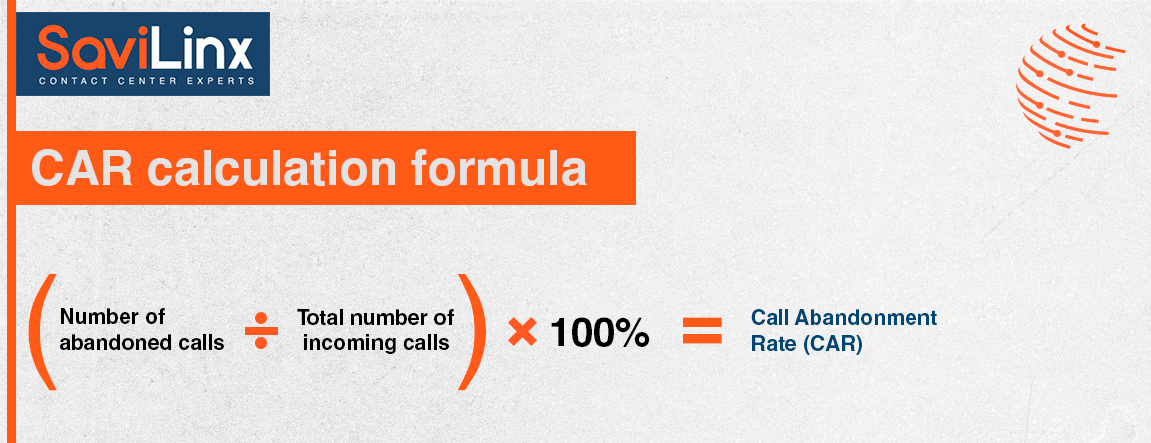
CAR calculation formula: (Number of abandoned calls / Total number of incoming calls) * 100% = Call Abandonment Rate (CAR)
To reduce CAR, call centers need to optimize operator scheduling by ensuring sufficient staffing during peak hours. The implementation of automatic call distribution (ACD) systems can help distribute the load evenly between operators. Also useful is the use of an interactive voice menu (IVR), which can provide customers with useful information or solve standard queries without operator involvement. Regular data analysis allows you to identify the reasons for call rejections and take steps to eliminate them, improving the overall customer experience.
Average Speed of Answer (ASA)
Average Speed of Answer (ASA) is a metric that measures the average time a customer spends in a queue before a call center operator answers the call, an important indicator of service level. This metric includes only calls that were answered, ignoring calls that were rejected or terminated by the customer before being connected.
ASA is calculated as the average waiting time for all incoming calls to be answered during a certain period. To do this, the total waiting time of all answered calls is divided by the total number of answered calls. A low ASA score is desirable because it indicates fast service, while a high score may indicate understaffing or inefficient processes.
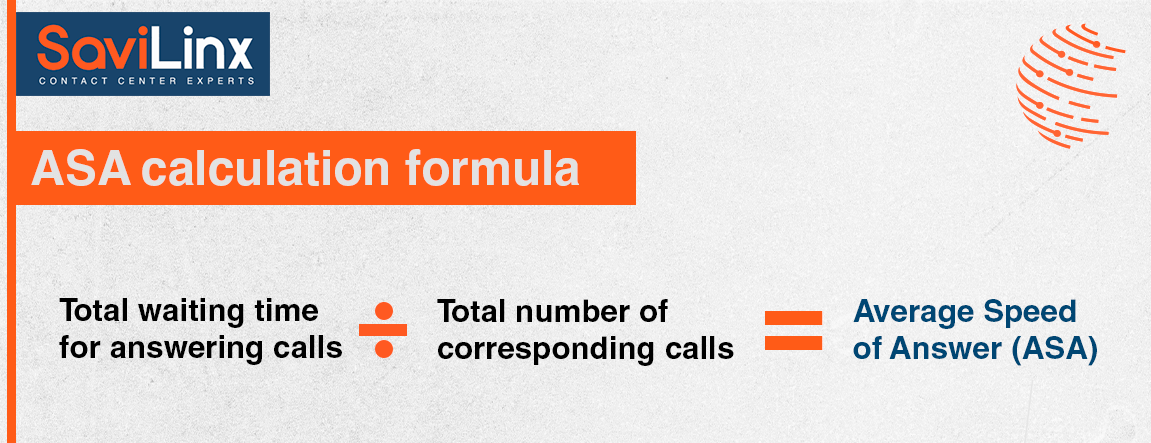
ASA calculation formula: Total waiting time for answering calls / Total number of corresponding calls = Average Speed of Answer (ASA)
To improve ASA, call centers need to optimize operator scheduling by ensuring sufficient staffing during peak hours. The use of technologies such as automatic call distribution (ACD) systems can help distribute the load evenly between operators. Training staff and implementing effective scripts to handle standard requests can also reduce wait times. In addition, analysis of peak periods and adaptation of work processes will reduce customer waiting time and increase overall satisfaction with the service.
Average After Call Work (ACW)
Average After Call Work (ACW) measures the average time a call center operator spends on final tasks after a call, such as updating the customer database or planning follow-up actions.
ACW is calculated by dividing the total time spent by all operators on call work by the total number of calls handled in a given period. The ideal ACW depends on each call center’s specific processes and standards, but typically too high can indicate inefficiencies, while too low can indicate a lack of attention to detail when handling calls.
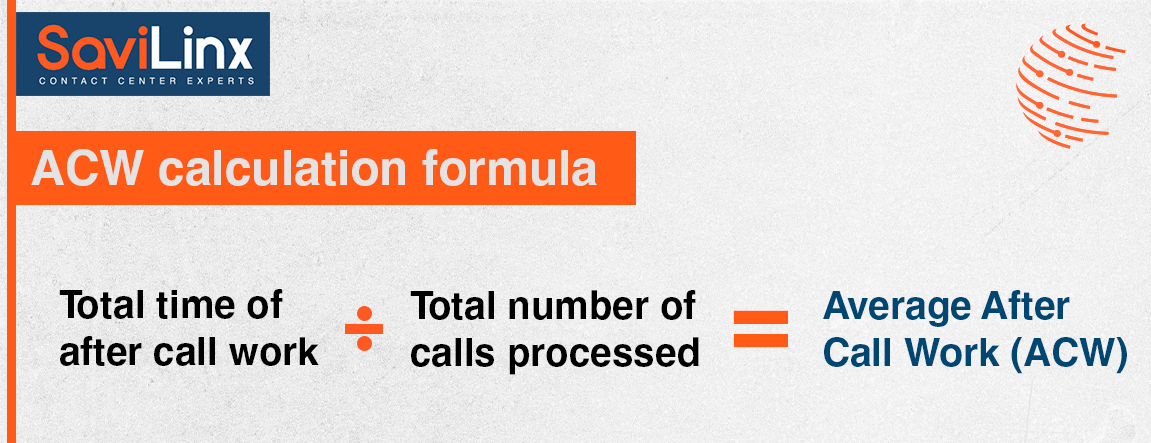
The ACW calculation formula looks like this: Total time of after call work / Total number of calls processed = Average After Call Work (ACW)
To improve ACW, call centers can implement more efficient CRM systems that automate data entry and reduce manual work. It is also helpful to train operators in effective on-call methods and to establish clear procedures for documenting and completing the necessary tasks. Regular analysis and optimization of ACW processes can help reduce the time required to complete post-call duties, increasing productivity and providing a better customer experience.
Call Transfer Rate
Call Transfer Rate (CTR) is a metric that reflects the percentage of calls transferred by a call center operator to another specialist or department, which indicates the level of specialization and efficiency in resolving inquiries.
CTR is calculated by dividing the number of calls transferred by the total number of calls handled and multiplying the result by 100 to get the percentage. A high CTR may indicate insufficiently trained staff or poorly organized workflows, while a low CTR usually indicates that most issues are being resolved at the first line of support.
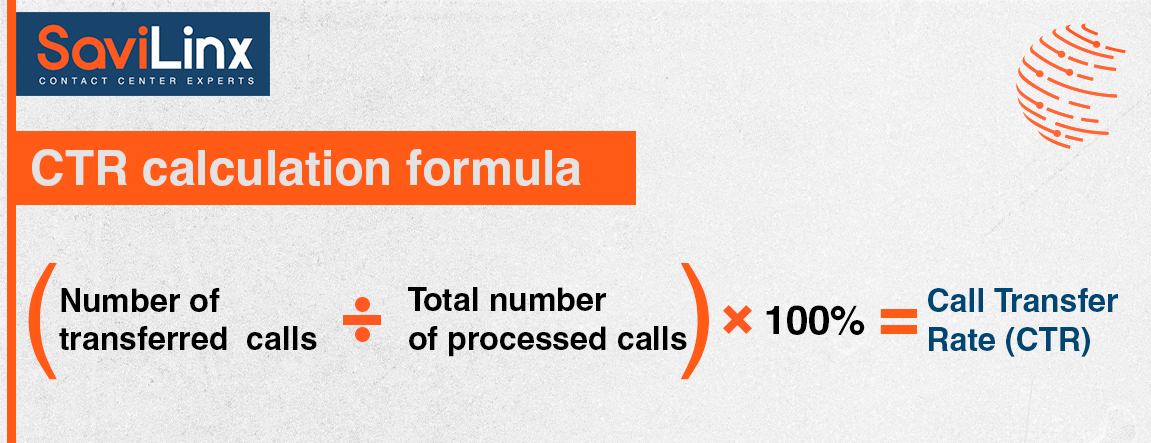
CTR calculation formula: (Number of transferred calls / Total number of processed calls) * 100% = Call Transfer Rate (CTR)
To reduce CTR, call centers need to improve training and training of operators, providing them with sufficient knowledge and tools to handle a wide range of inquiries. Implementing more detailed problem definition scripts and quick access to knowledge bases can help operators provide answers without having to transfer the call. It is also useful to regularly analyze the reasons for call transfers to identify and eliminate systemic weaknesses in service processes.
Occupancy Rate
Occupancy Rate (OR) in the context of a call center reflects the percentage of time that agents are busy handling calls or performing post-call tasks, which is a key indicator of resource efficiency.
OR is calculated by dividing the total time operators are busy (talk time and after-call work) by the total time available to work (usually a work shift) and multiplying the result by 100 to get a percentage. A high OR indicates high operator engagement, but if it is too high, it can lead to staff burnout. A low OR may indicate understaffing or overstaffing.
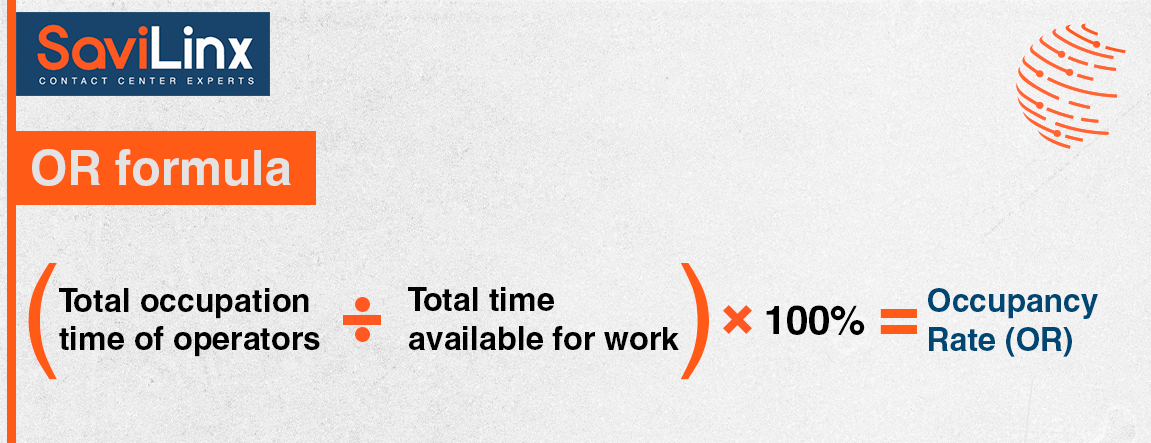
OR formula: (Total occupation time of operators / Total time available for work) * 100% = Occupancy Rate (OR)
To optimize the OR, call centers need to balance the workload, ensuring that operators are not overworked and have enough time to rest. Effective scheduling, forecasting call volumes, and adapting staffing levels to peak periods can help maintain an optimal OR. Using automated tools to distribute the workload and train operators in efficient work methods also help increase productivity without undue stress on staff.
Time in Queue
“Time in Queue” is a metric that measures the average time all customers spend in the queue, regardless of whether the call was answered or the customer ended the call. TiQ takes into account the overall experience of all customers who tried to contact the call center.
Queuing time is calculated as the average time spent by all customers waiting for an operator’s response. To do this, the total waiting time of all customers who contacted the call center is divided by the total number of calls that were answered. A low queue time is an indicator of good service because customers are not forced to wait long, while a high queue time can indicate problems with operator availability or inefficient work processes.
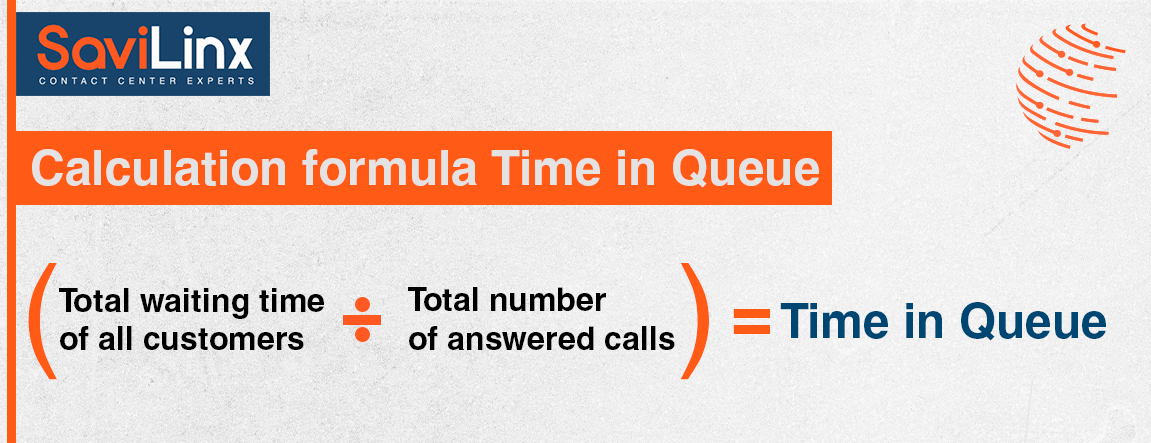
Calculation formula: Total waiting time of all customers / Total number of answered calls = Time in Queue
To reduce waiting time in the queue, call centers need to optimize the operator’s work schedule, ensuring a sufficient number of personnel during peak hours. Implementing technologies such as Automatic Call Distribution (ACD) and Interactive Voice Response (IVR) systems can help spread the load and provide useful information to customers while on hold. It is also important to analyze peak periods and adapt work processes to increase efficiency and reduce customer waiting times.
Longest Delay in Queue
“Longest Delay in Queue” (LDQ) is a metric that captures the longest time a customer waits in a queue to connect with a call center operator, reflecting the maximum delay in service.
LDQ is defined as the longest time a customer waited for a response during a specified period (for example, during a day). This metric does not take into account the average waiting time, but focuses on the worst case. While a specific “good” or “bad” score can vary depending on the service standards of a particular call center, generally longer wait times are considered negative because they can lead to customer dissatisfaction.
To improve LDQ, call centers need to analyze the causes of long waits and optimize resource allocation. Effective scheduling to ensure sufficient operators during peak hours is critical. The implementation of technologies such as Automatic Call Distribution (ACD) and Interactive Voice Response (IVR) can help reduce the burden on operators and provide customers with alternative ways to resolve their queries without having to wait long. It is also important to regularly reassess service processes and implement changes aimed at increasing efficiency and responsiveness.
3. Performance metrics and financial metrics
Performance metrics and financial metrics in call centers act as strategic tools to assess the cost effectiveness and overall productivity of the organization. They play the role of navigators in making management decisions aimed at cost optimization and revenue maximization. Thanks to these metrics, you can determine how profitable each invested dollar is and which processes need to be adjusted to improve financial efficiency. They are also important for measuring internal performance, helping to establish a link between the resources spent on customer service and the final financial results.
Conversion Rate
Conversion Rate (CR) in a call center context reflects the percentage of calls that lead to a desired customer action, such as purchasing a product or subscribing to a service, which is a key indicator of sales and service performance.
CR is calculated by dividing the number of successful conversions resulting from calls by the total number of calls that had the potential to convert and multiplying the result by 100 to get the percentage. A “good” CR rate can vary by industry and type of product or service, but in general, a higher percentage is considered positive because it demonstrates the effectiveness of customer interaction and the ability to convert interest into action.
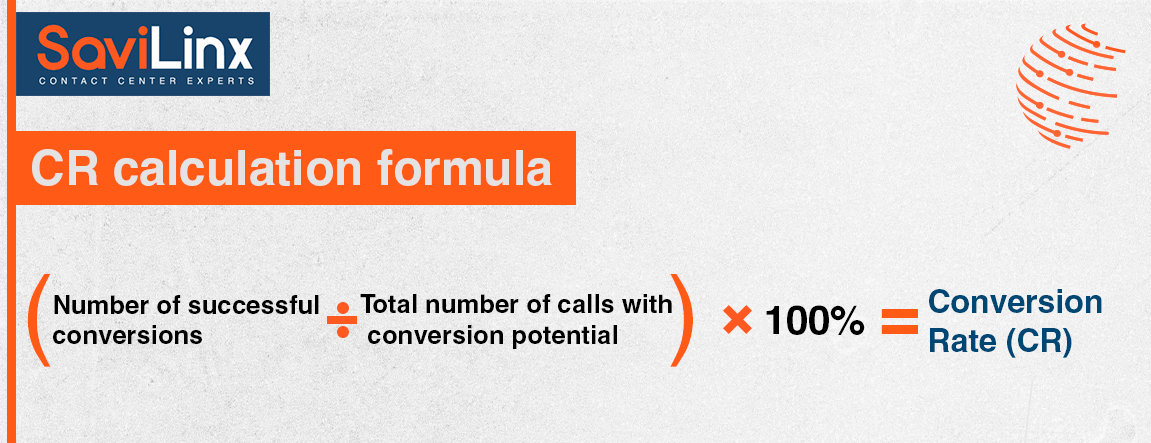
CR calculation formula: (Number of successful conversions / Total number of calls with conversion potential) * 100% = Conversion Rate (CR)
To improve CR, call centers can focus on upskilling operators through specialized sales and communication training, allowing them to more effectively identify customer needs and offer appropriate solutions. Using personalized scripts and approaches to each customer, as well as analyzing data to determine the most effective sales strategies, can significantly increase the chances of conversion. In addition, it is important to optimize dialogue processes and implement a performance tracking system in order to quickly adjust service tactics and increase the overall efficiency of the call center.
Average Revenue Per Call (ARPC)
Average Revenue Per Call (ARPC) is a financial metric that measures the average revenue a call center receives from each call, reflecting sales performance and contribution to the company’s overall revenue.
ARPC is calculated by dividing the total revenue received from calls in a given period by the total number of calls made in that same period. A performance is considered good if it exceeds the average revenue per call compared to previous periods or industry standards, while a low ARPC can indicate inefficient sales or quality of service issues.
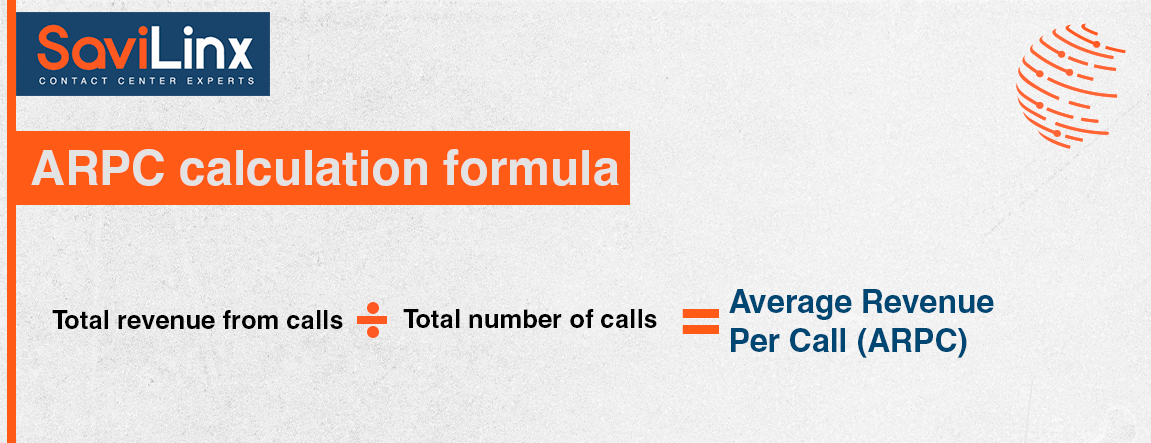
The ARPC calculation formula looks like this: Total revenue from calls / Total number of calls = Average Revenue Per Call (ARPC)
To increase ARPC, call centers need to focus on improving service quality and sales performance. This may include training operators in persuasive sales techniques, improving their product competence and improving their communication skills. It is also important to use personalized approaches to customers, based on the analysis of data on previous interactions and customer preferences. Optimizing call scripts and implementing targeted offers can also help increase your average revenue per call.
Cost Per Contact
Cost Per Contact (CPC) is a metric that measures the cost of each customer interaction in a call center, including calls, emails and other contact channels, which is an important measure of cost effectiveness.
CPC is calculated by dividing the call center’s total costs by the total number of customer contacts for a given period. Costs can include staff wages, technology costs, space rent, equipment maintenance, and other operating costs. A low CPC is considered positive because it indicates high cost efficiency, while a high CPC may indicate the need to optimize processes or reduce costs.
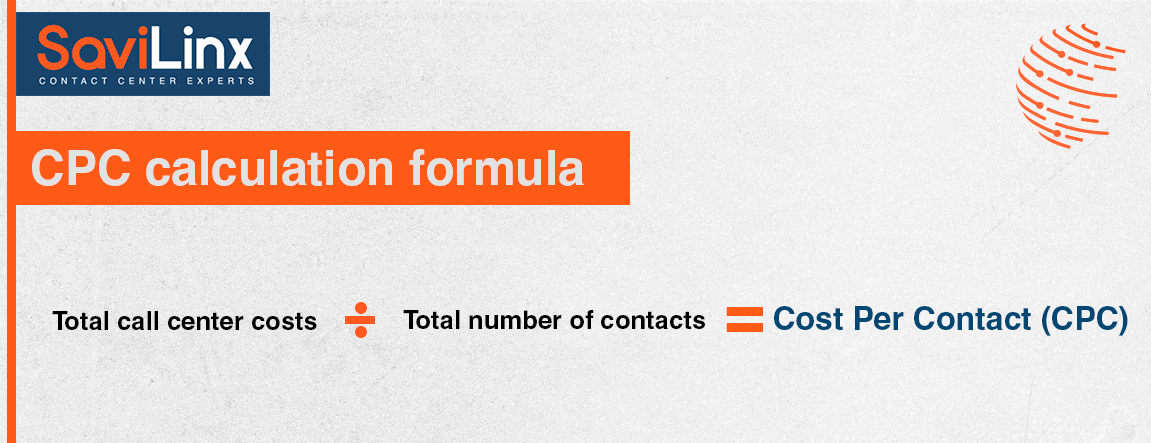
CPC calculation formula: Total call center costs / Total number of contacts = Cost Per Contact (CPC)
To reduce CPC, call centers can implement automation of routine processes, which will reduce the time it takes to process each contact and reduce the burden on staff. Optimizing operator schedules to meet peak workloads can help increase productivity without increasing staffing. Also effective is the implementation of multi-channel service strategies that allow customers to choose the most convenient way of contact, thereby spreading the load and reducing overall service costs. Thorough cost analysis and continuous improvement of internal processes is key to maintaining a competitive CPC level.
Forecast Accuracy
Forecast Accuracy is a metric that measures the effectiveness of call center load forecasting by comparing forecasted call volume to actual data, which is critical for resource optimization.
Forecast accuracy is calculated as the percentage of agreement between predicted and actual indicators. This can include the number of calls, the average call duration, and the overall load on the call center. The calculation formula can be presented as: Forecast Accuracy = (1 – (Absolute deviation of the forecast / Total number of actual calls)) * 100%, where the absolute deviation of the forecast is the difference between the predicted and actual indicators. A high percentage of forecast accuracy is considered good because it indicates effective planning, while a low percentage may indicate a need to improve forecasting methods.
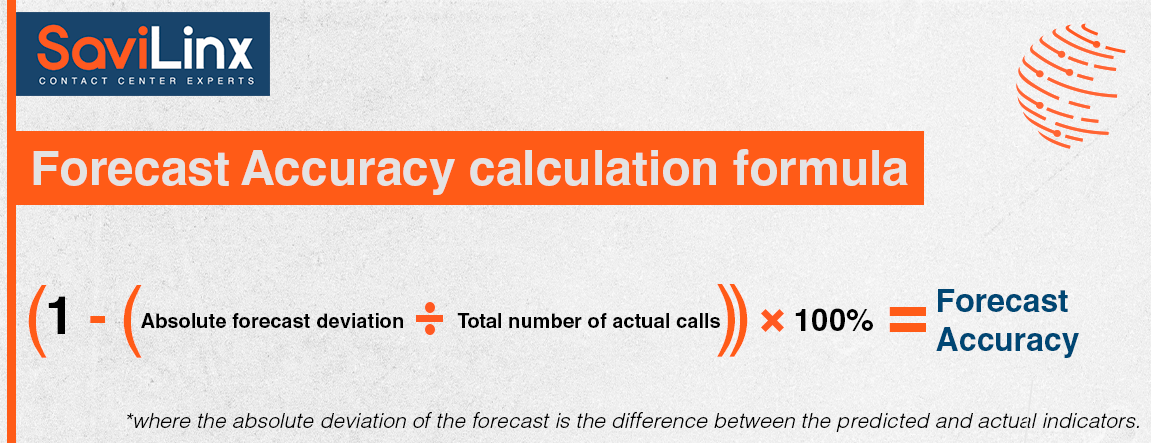
The calculation formula can be presented as: (1 – (Absolute forecast deviation / Total number of actual calls)) * 100% = Forecast Accuracy
*where the absolute deviation of the forecast is the difference between the predicted and actual indicators.
To improve forecasting accuracy, call centers need to use historical data and analytical tools to more accurately identify future trends. Regular analysis of deviations between forecasts and actuals will help identify weaknesses in existing forecasting models. It is also important to take into account seasonal fluctuations, marketing campaigns and other external factors that can affect the workload of the call center. Incorporating advanced technologies such as machine learning and artificial intelligence can significantly improve the accuracy of forecasts, allowing call centers to more efficiently allocate resources and maintain high levels of customer service.
Budget Variance
Budget Variance is a financial metric that reflects the difference between the planned budget costs and the actual costs of the call center, which allows you to assess the accuracy of budget planning and control over costs.
The budget variance is calculated as the difference between planned (budgeted) costs and actual costs for a certain period. A positive variance (when actual costs are less than planned) is considered good because it indicates resource savings. A negative variance (when actual costs exceed plan) can indicate problems with cost control or unexpected costs. A neutral variance indicates that costs are in line with plan.
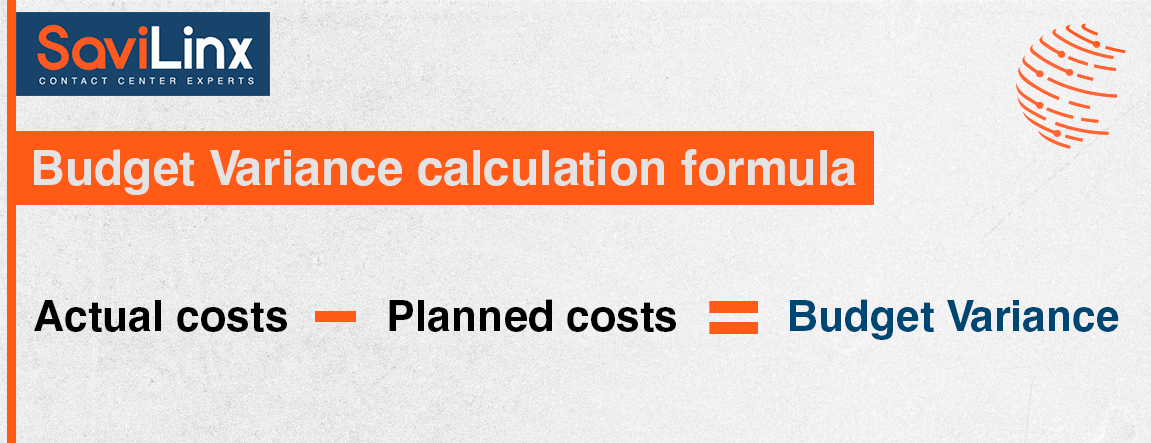
The calculation formula is as follows: Actual costs – Planned costs = Budget Variance
To improve Budget Variance, call centers need to improve their budget planning processes, including careful analysis of historical data and forecasting of future costs. It is also important to establish clear procedures for monitoring expenditures and taking corrective action when deviations from the budget are identified. Regular review of budget allocations and their adaptation to changing business conditions will help ensure more accurate budgeting. Involving all call center departments in the budgeting process can increase accountability for spending and help better understand the organization’s financial goals.
Strategic Goal Achievement
The metric “Strategic Goal Achievement” (SGA) reflects the degree of achievement of the strategic goals of the call center, measuring the effectiveness of the implementation of planned tasks and initiatives in accordance with the long-term strategy of the organization.
SGA is calculated by comparing actual results with the goals defined in the strategic plan. This can include quantitative indicators, such as achieving a certain level of customer satisfaction, or qualitative indicators, such as the introduction of new technologies. A high percentage indicates the successful achievement of strategic goals, while a low percentage may signal the need to revise the strategy or methods of its implementation. A neutral indicator indicates that the results meet planned expectations.
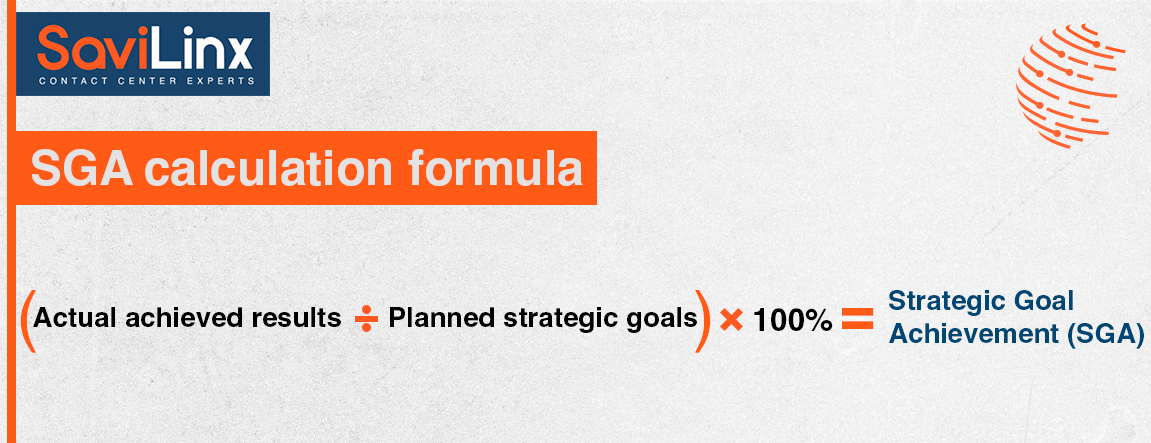
The formula may look like this: (Actual achieved results / Planned strategic goals) * 100 = Strategic Goal Achievement (SGA)
To improve SGA, call centers need to ensure a clear understanding of the strategic goals at all levels of the organization and regularly review the progress of their implementation. It is important to set realistic but ambitious goals and develop detailed action plans to achieve them. Involving employees in the planning process and providing them with the necessary resources and training can increase their motivation and commitment to shared goals. It is also useful to use a system of key performance indicators (KPIs), which help monitor important aspects of activity and make timely adjustments to the strategy.
4. Workforce metrics
Call center workforce metrics serve as indicators for evaluating staff utilization and productivity. They allow you to analyze the distribution of working time, determine the optimal number of employees for
ensure continuity of work and identify training and development needs of personnel. With these metrics, call center management can make informed decisions about scheduling work shifts, assigning tasks, and identifying recruiting needs, all of which help improve overall productivity and reduce costs.
Adherence to Schedule
The “Adherence to Schedule” metric reflects the percentage of time that call center operators work according to the established schedule, which is key to providing optimal customer service.
Adherence to the schedule is calculated by comparing the actual time worked by the operators with their planned work schedule. This includes time spent on phone calls as well as other tasks such as responding to emails or chats. A high percentage indicates good adherence to the schedule, a low score may indicate problems with scheduling or employee discipline, and an average score is considered neutral and may be the basis for further analysis.
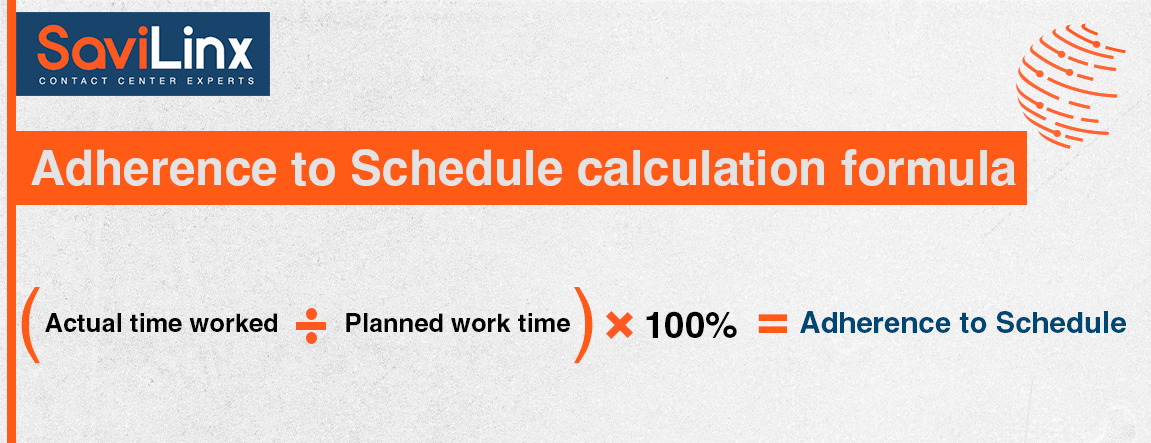
The calculation formula can be as follows: (Actual time worked / Planned work time) * 100% = Adherence to Schedule
To improve schedule adherence, call centers need to implement clear procedures for planning and monitoring working hours. Educating employees on the importance of staying on schedule and how it affects overall productivity can increase their accountability. Using time management software will help you accurately track schedule deviations and respond quickly to them. Incentives and incentive programs for operators who adhere to the schedule can also help improve this metric. In addition, regular review and optimization of work schedules, taking into account peak and quiet periods, will allow to better meet the needs of both employees and customers.
Attrition Rate
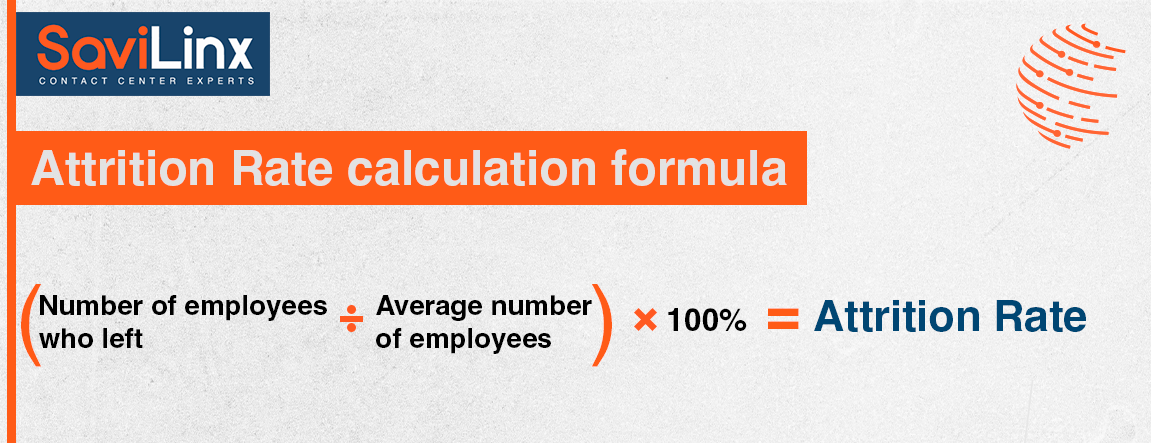
“Attrition Rate” is a metric that reflects the percentage of employees who leave the call center over a period of time, which is an important indicator of employee satisfaction and engagement.
The turnover rate is calculated by dividing the number of employees who left the company in a certain period by the average number of employees in the same period and multiplying the result by 100 to get the percentage. High turnover is a bad indicator as it may indicate problems in the work environment or management, low turnover is considered good as it indicates stability and staff satisfaction, and medium turnover can be neutral and depends on industry standards.
Attrition Rate calculation formula: (Number of employees who left / Average number of employees) * 100% = Attrition Rate
To improve employee turnover, call centers need to focus on creating a positive work environment and developing a corporate culture. It is important to conduct regular employee satisfaction surveys and implement changes based on the feedback received. Training and career development programs can increase staff motivation and engagement. In addition, competitive wages and social security packages also play a key role in reducing employee turnover. Effective management and leadership that recognizes and rewards the contributions of each employee can significantly improve job satisfaction and reduce employee turnover.
Absenteeism Rate
“Absenteeism Rate” is a metric that tracks the percentage of unplanned absences by call center employees, which affects productivity and customer service quality.
The level of absence from work is calculated as the ratio of the total number of missed working days to the total number of planned working days for a certain period, expressed as a percentage. High absenteeism is a bad indicator as it may indicate health or employee motivation issues, low levels are considered good as they indicate high staff engagement and reliability, and medium levels can be neutral and depend on industry norms.
Absenteeism Rate calculation formula: (Total number of missed working days / (Number of employees * Number of working days in the period)) * 100% = Absenteeism Rate
To improve absenteeism, call centers need to implement health and wellness programs for employees, which may include health insurance, fitness activities, and health counseling. It is also important to create a positive work environment and provide flexible work schedules that allow employees to better combine work and personal life. Regular feedback and recognition of employees’ achievements can increase their motivation and reduce the number of unplanned absences. In addition, analyzing the causes of absences and developing targeted measures to eliminate them will help reduce the absence rate and increase the overall productivity of the call center.
Employee Satisfaction
“Employee Satisfaction” is a metric that measures the level of staff satisfaction with working conditions, corporate culture and management, which directly affects employee productivity and loyalty.
Employee satisfaction is typically measured through surveys that assess various aspects of the job, including satisfaction with pay, working conditions, relationships with management, career opportunities, and more. The results of surveys can be presented as a percentage of satisfied employees or an average score on a certain scale (for example, from 1 to 5). A high score indicates high satisfaction, a low score indicates staff dissatisfaction, and an average score may indicate potential areas for improvement.
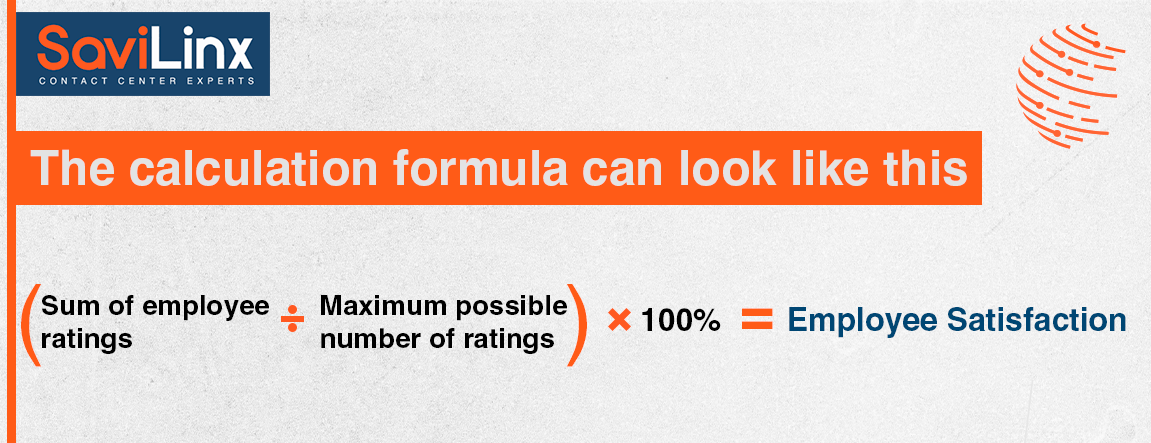
The calculation formula can look like this: (Sum of employee ratings / Maximum possible number of ratings) * 100% = Employee Satisfaction
To improve employee satisfaction, it is important for call centers to create an open dialogue with staff and collect feedback regularly. Implementing development and training programs, providing a competitive salary and benefits package can increase motivation and satisfaction. It is also important to recognize and reward employee achievements, create opportunities for career growth and maintain a healthy work environment. Providing flexible work schedules and maintaining a work-life balance can also contribute to increased staff satisfaction.
Training Hours
The “Training Hours” metric reflects the total number of hours spent on professional training and development of call center employees, which is an important factor in improving qualifications and work efficiency.
“Training Hours” are calculated by adding up all hours spent by employees in trainings, seminars, webinars and other forms of professional development during a certain period. A high number of training hours indicates intensive investment in staff development, which is positive. A low score may indicate a lack of attention to learning, which can negatively affect productivity. The average reflects the standard level of training, which may be acceptable depending on the specifics of the call center.
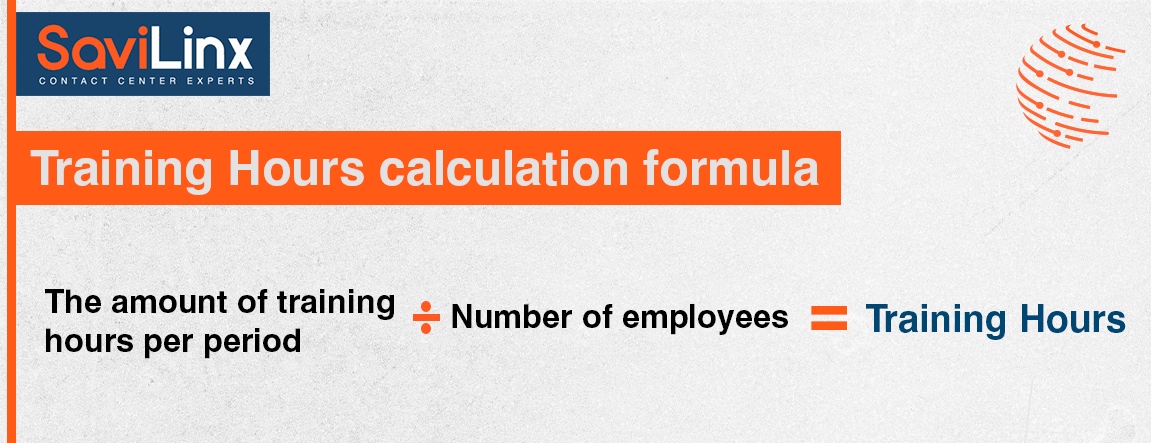
The formula for calculating Training Hours can be as follows: The amount of training hours per period / Number of employees = Training Hours
To improve the number of training hours, call centers can develop comprehensive training programs that meet the needs of the business and employees. It is important to set clear learning goals and provide access to a variety of learning resources. Regular updating of training materials and methods will help keep training relevant and effective. Involving employees in planning their professional development and providing opportunities for self-directed learning can increase motivation and engagement. It is also useful to implement a system for tracking and evaluating the results of the training to ensure that it is effective and aligned with the call center’s business goals.
5. Metrics of technical efficiency
Metrics of availability and technical efficiency in call centers play an important role in ensuring smooth and high-quality operation of the system. They help assess the stability and reliability of the technology infrastructure, which is critical to maintaining a high level of customer service. Using these metrics allows you to identify and eliminate technical problems, ensure efficient allocation of resources and maintain optimal equipment performance. This helps to increase the overall productivity of the call center and improve the customer experience of communication with the support service.
System Downtime
The System Downtime metric reflects the total time that call center information systems are not functioning properly, affecting productivity and customer satisfaction.
System downtime is calculated as the sum of all periods when the system was unavailable for use during a certain period of time. This includes unplanned outages, maintenance and other disruptions. High downtime is bad because it indicates system instability and can lead to lost revenue and customer dissatisfaction. A low indicator indicates the reliability of the system and the efficiency of the IT infrastructure. The average may be acceptable, but requires attention to further reduce downtime.
To improve system downtime, call centers need to regularly perform preventative maintenance and IT infrastructure upgrades. It is important to have a robust disaster recovery plan and data backup to minimize information loss. Implementing real-time monitoring systems will help quickly identify and fix problems before they lead to significant downtime. It is also useful to train the staff in the basics of technical support and rapid response to technical problems. Recruitment of qualified IT specialists
Equipment Utilization Rate
The “Equipment Utilization Rate” metric reflects the efficiency with which a call center uses its technical equipment, including computers, headsets and other devices.
The equipment utilization rate is calculated as the ratio of the time the equipment was actively used to the total time the equipment was available for use. A high indicator indicates that the equipment is used efficiently and at full capacity. A low score may indicate insufficient resource utilization or hardware overload. An average may be acceptable, but requires analysis to identify opportunities for optimization.
The formula for calculating the Equipment Utilization Rate can look like this: (Total time of active use of equipment / Total time of equipment availability) * 100% = Equipment Utilization Rate
To improve equipment utilization, call centers need to conduct an audit of existing equipment and its usage to identify unused or underutilized resources. Regular maintenance and equipment upgrades can increase its reliability and performance. It can also be effective to implement an equipment management system that will allow better planning of its use and replacement. Training staff on the proper use of equipment and implementing energy conservation policies can help reduce downtime and increase equipment efficiency. Involving employees in the optimization process and taking into account their feedback can also contribute to increasing the overall efficiency of the use of technical resources.
Call Quality Index
The “Call Quality Index” metric reflects the overall quality of voice communication in the call center, taking into account the clarity of the sound, the absence of noise and interruptions, which are key to customer satisfaction.
The call quality index is calculated based on a number of parameters such as transmission delay, delay variation, data packet loss and other factors that affect the quality of voice communication. A high call quality index indicates a high quality of communication, which is desirable. A low indicator indicates problems with the quality of communication, which can negatively affect the perception of call center services by customers. Average may be acceptable but needs attention for further improvement.
The formula for calculating the Call Quality Index looks something like this: (1 – (Packet loss + Delay + Jitter)) * Weighting factors = Call Quality Index
To improve the call quality index, the call center needs to focus on improving the technical infrastructure and equipment. This may include upgrading network equipment, increasing network bandwidth, and using high-end headsets. Regularly testing your network for latency, packet loss, and other issues will help identify and fix problems. Training staff in the proper use of equipment and techniques to ensure voice clarity when speaking with customers is essential to maintaining high quality calls. Involving employees in the improvement process and taking into account their feedback can contribute to improving the overall quality of communication in the call center.
What metrics to use?
In conclusion, the analysis of 30 metrics for contact centers opens wide opportunities for improving their efficiency. Each metric plays a role in measuring different aspects of call center operations, from the quality of customer service to the technical reliability of equipment. However, it is important to understand that not all metrics are equally useful for every business. The choice of metrics for monitoring should be based on the specific goals and needs of the organization.
Over-focusing on a large number of metrics can lead to unnecessary complexity and distraction from key priorities. Therefore, it is recommended to choose those metrics that most accurately reflect the successes and challenges faced by the call center and that can be used to actually improve processes and results. A balanced approach to the selection and analysis of metrics will allow contact centers to achieve high productivity and customer satisfaction.
Conclusions
Metrics are the backbone of call center operations, offering a clear view of performance, customer satisfaction, and cost efficiency. They help identify weak points, improve workflows, and align operations with strategic goals. However, selecting the right metrics is essential to avoid complexity and maintain focus. By combining customer service, workforce, and financial metrics with technical efficiency measures, call centers can deliver exceptional service, drive growth, and achieve sustainable success.
Call Center Metrics FAQs: Understanding Key Performance Indicators
Metrics provide insights into customer satisfaction, operational efficiency, and workforce productivity, enabling call centers to identify and improve weak areas.
Customer service metrics include CSAT, NPS, FCR, and CES, which measure satisfaction, loyalty, and the ease of customer interactions.
Metrics like ARPC and CPC help optimize costs, monitor revenue generation, and ensure profitability while maintaining service quality.
Workforce metrics such as adherence to schedule and training hours ensure optimal resource utilization and help in enhancing employee satisfaction and productivity.
Metrics like system downtime and call quality index ensure the reliability of infrastructure and the quality of customer interactions, directly impacting service delivery.
Related Posts